Supermarket Sales Analysis
(Excel + Power BI)
Analyzed supermarket sales data to identify trends and performance indicators across product lines, customer types, and purchase times.
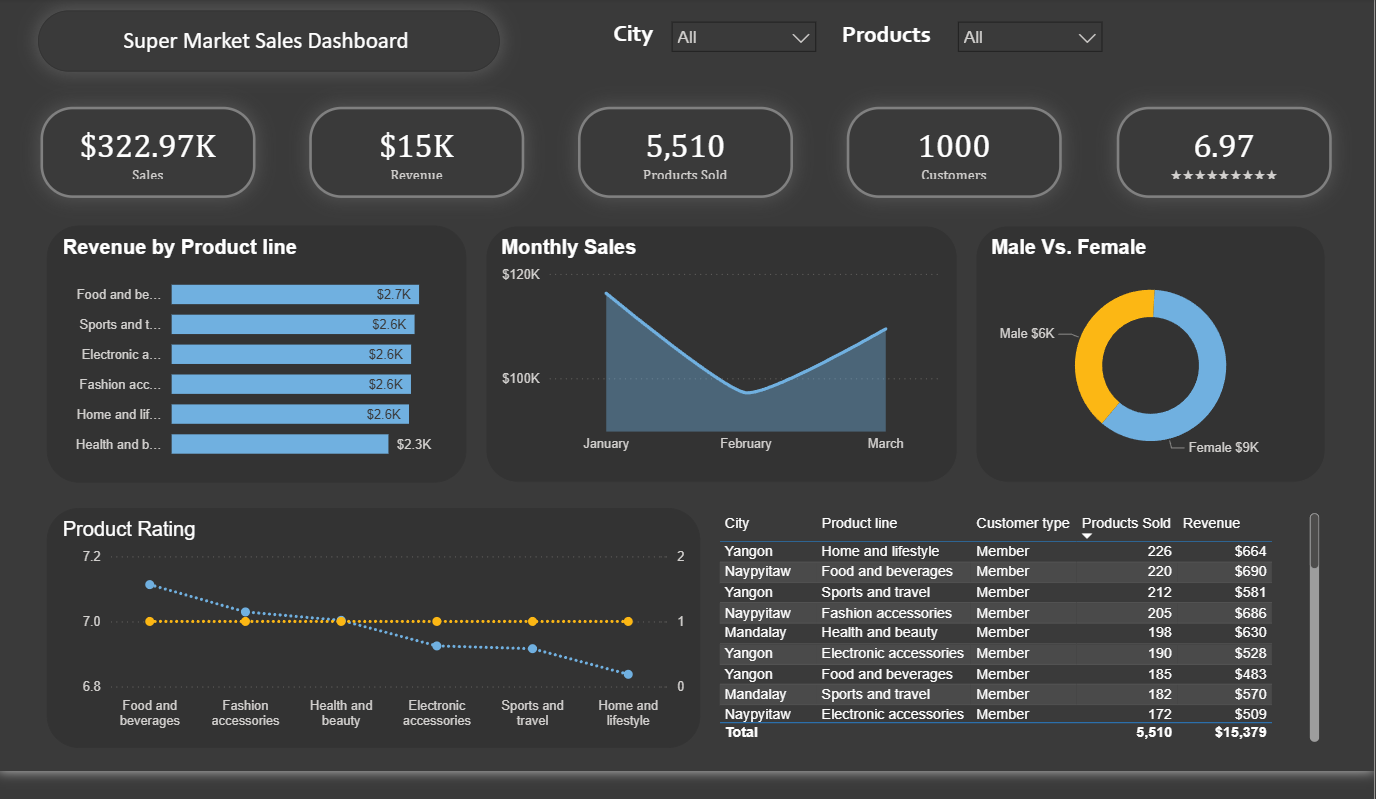
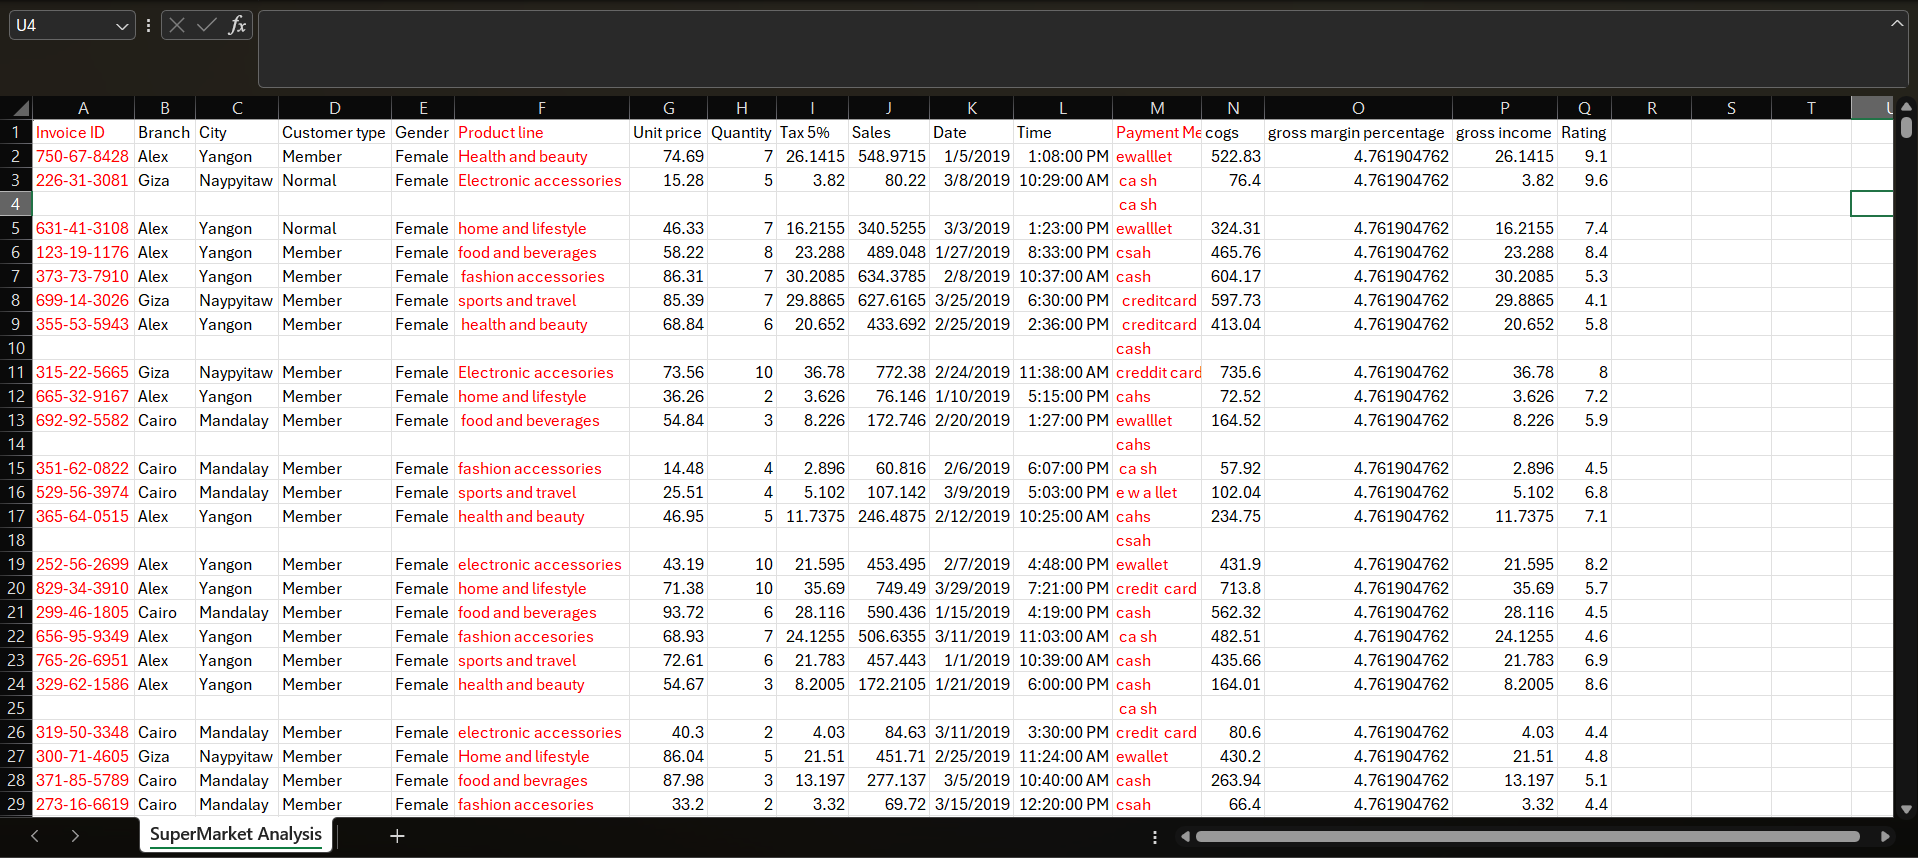
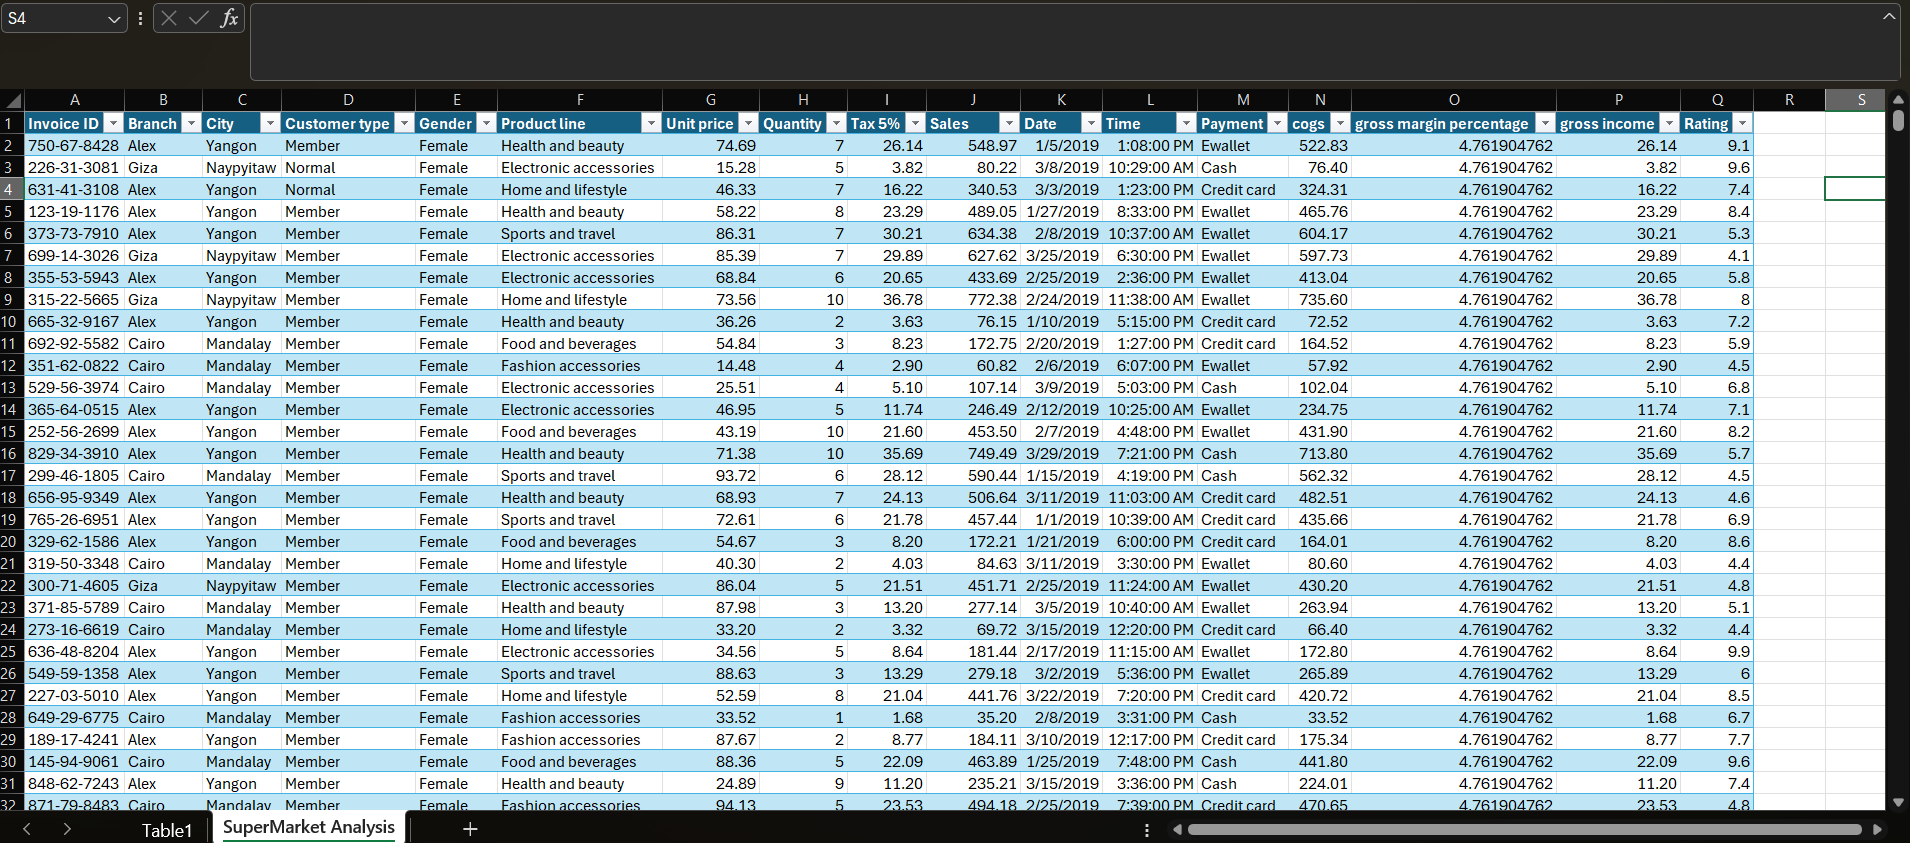
The images shown are the dashboard, messy data, and cleaned data, respectively.
View Excel Data on Google Drive
| Objective: | |
| Tools Used: | |
| Insights: | |
| Outcome: | Built a clear dashboard that helped simulate real-world analysis using pivot tables and Power BI dashboards. Great for sales trend reporting practice. |